
We will study the main characteristics to consider when graphing quadratic functions in standard and vertex form. We will find the vertices and determine whether it is a minimum or maximum when graphing quadratic functions.
Graphing Quadratic Functions Using Standard Form
We know that a quadratic function is a polynomial function of degree 2. And, in its standard form, it is
f(x) = ax2 + bx + c , a ≠ 0 (E.c 1)
This can be expressed in normal form as
f(x) = a(x – h)2 + k (E.c 2)
By completing the square.
Vertices of a Quadratic Equation
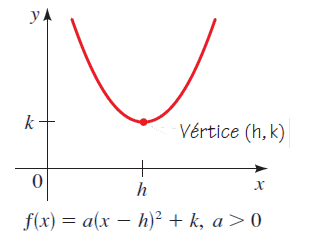
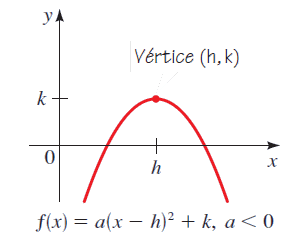
Every quadratic function f, when graphed, is a parabola with vertex (h, k).
- If a > 0, the parabola opens upwards.
- If a < 0, the parabola opens downwards.
Exercise 1) Express the following quadratic function in its standard form, and then graph the quadratic function using standard form.
f(x) = 2x2 – 12x + 23 (E.c 3)
Solution
First, we factorize 2 of the x terms.
f(x) = 2(x2 – 6x) + 23
We complete the square by adding (b/2)2 inside the parentheses.
ax2 + bx + (b/2)2
This way, we complete the square. For our case, (6/2)2 = 9, we add 9 inside the parentheses and subtract (2).(9) outside.
f(x) = 2(x2 – 6x + 9) + 23 – (2).(9)
It is factored by trial and error, and then simplified.
f(x) = 2(x – 3)(x – 3) + 23 – 18
f(x) = 2(x – 3)2 + 5 (E.c 4)
We have found the standard form of the original quadratic function.
From the previous equation (Eq. 4), we can deduce that h = 3 and k = 5, considering the standard form (Eq. 2). Therefore, the vertex is
(3 , 5)
We also know that from the quadratic function in its standard form, a=2, which indicates that a>0. Consequently, the parabola of the quadratic function opens upwards.
Now, we always calculate the y-intercept when x = 0. This way, we have one more point when graphing quadratic functions.
f(0) = 2(0)2 – 12(0) + 23
f(0) = 23
To find another point on the curve of the quadratic equation, we evaluate a point after the vertex, which could be when x=5.
f(5) = 2(5)2 – 12(5) + 23 = 2(25) – 60 + 23
f(5) = 50 – 37 = 13
With this data, we can sketch the graph of the quadratic function.

KNOW THE DIFFERENT TUTORING SERVICES OFFERED BY UNIVERSITY ADVISER
We have Professors in multiple specialties, who adapt to your needs as a University Student, High School, Undergraduate, Master’s, and Doctorate.


Graphing Quadratic Functions in Standard Form
In the previous section, we first found the standard form, and then calculated the vertex. This way, we could graph the quadratic function. In this section, we will use the standard form (Eq. 1), which is the most common way quadratic equations are presented.
First, we must define what is meant by a maximum and a minimum in a quadratic function.
Definición y Cálculo de los Máximos y Mínimos de Ecuación Cuadrática
A maximum refers to the highest point of the parabola, where the function reaches its highest value and then begins to descend.
A minimum refers to the lowest point of the parabola, where the function reaches its lowest value and then begins to rise.
- Quadratic functions have a minimum value at the vertex when a>0, meaning when the parabola opens upwards.
- Quadratic functions have a maximum value at the vertex when a<0, meaning when the parabola opens downwards.
To calculate the minimum or maximum vertex of the quadratic function, we have the following equation:
x = h = (-b)/2a (E.c 5)
Where a and b are the coefficients of the quadratic equation arranged in standard form.
Steps to Plot in Standard Form
- First, we need to verify that the quadratic function is written in Standard Form (Eq. 1).
- Then, we extract each coefficient from the equation: a, b, and c.
- We find xx using Equation 5.
- Next, we evaluate x in the quadratic function of the problem f((−b)/2a). This helps us find the minimum or maximum value, depending on the case.
- We find the point where the curve intersects the y-axis when x=0.
- We find the solutions where the function intersects the x-axis when f(x)=0.
Exercise 2) Graph the quadratic functions in standard form.
f(x) = -x2 + 6x – 5
Solution
The values of the coefficients of the equation are a=−1, b=6, and c=−5.
Since a<0, the parabola opens downwards, therefore, the function has a maximum at its vertex. This maximum occurs at
x = (-6)/(2(-1)) = 6/2
x = 3
The maximum of the function is at f(3). We substitute x=3 into the quadratic equation:
f(3) = -(3)2 + 6(3) – 5 = -9 + 18 – 5
f(3) = 4
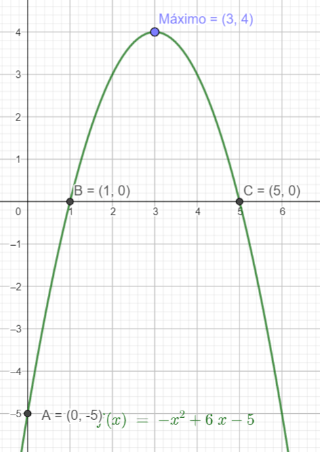
The vertex would be at the point (3, 4).
Now we find the point where the curve intersects the y-axis, when x=0.
f(0) = -(0)2 + 6(0) – 5
f(0) = -5
We find the solutions where the function intersects the x-axis when f(x)=0.
-x2 + 6x – 5 = 0
We multiply the entire function by -1.
x2 – 6x + 5 = 0
We factorize the quadratic function trinomial by trial and error, looking for two numbers that multiply to give 5 and add up to -6.
(x + )(x + ) = 0
Nota: If the factorization were more complex, we can use other factoring techniques such as the Decomposition method and the Triple Split method we studied earlier..
These numbers are -5 and -1.
(x – 5)(x – 1) = 0
We have two factors and we solve for their respective x.
x – 5 = 0 x – 1 = 0
x = 5 x = 1
With these points on the curve that we have found, we can plot the graph of the quadratic function. In summary, we have:
f(3) = 4 f(0) = 5 f(5) = 0 f(1) = 0
We plot it on a Cartesian plane, and we have the graph.

Do you need help with your calculus homework, assignments, and university work? At University Advisor, you can find the right teacher or tutor to help you with your calculus university assignment.
Plotting a quadratic function in the GeoGebra software
he first thing we need to plot quadratic functions is access to the GeoGebra executable (Version 6) on the computer or its online version (Executables, Installation, and Online GeoGebra). GeoGebra implemented this system more than a year ago, which requires you to create an account to save your projects in both the online version and the executable. You can also choose to download the GeoGebra Classic 5 version to install it on your computer.
Steps to graph a quadratic function in GeoGebra
- We open GeoGebra on our computer, and we’ll see something like this:

- We select the Input bar and then enable the Integrated Keyboard of GeoGebra. This allows us to write and insert any equation, in our case, a quadratic function. It is located at the bottom left.

- We write the quadratic function that we want to graph using the Integrated Keyboard, and then press the Enter button.

For further illustration, we recommend this YouTube video explaining step by step how to graph in GeoGebra. Additionally, it will explain the intercepts with the axes of the plane and the vertex of the quadratic function.
Graphing a quadratic function in Excel
We need Microsoft Excel to graph quadratic equations, in any of its versions on your computer. We recommend using Excel 2016 and 365 versions.
To graph a quadratic function in Excel, you can follow these general steps:
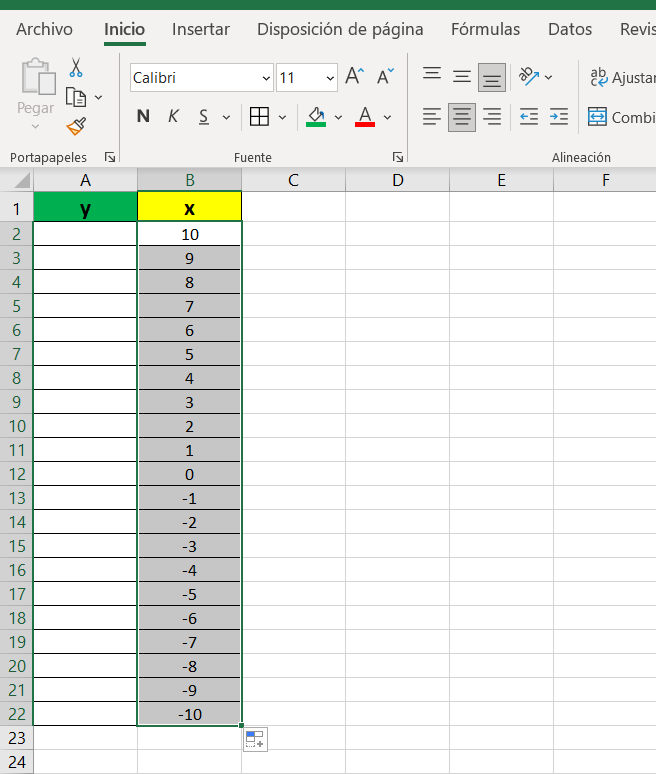
- We need to create a table with two columns and their respective headers, which in our case would be with the variables x and y.
- Give values to the independent variable x, you can take a range from 10 to -10, so there would be 21 points on the graph.
- To fill in these values, write the first three terms of the x values, in this case, it can be 10, 9, and 8, then select the three, and in the bottom right corner of the last number, a square appears, drag it to the end of the table to fill in the other empty cells.
- We select the first empty cell in the column of the variable y, double-click it, and enter the quadratic equation. In our example, it will be x2−4x+7. Wherever the variable x appears in the equation, we replace it with the first cell in the column of the variable x.
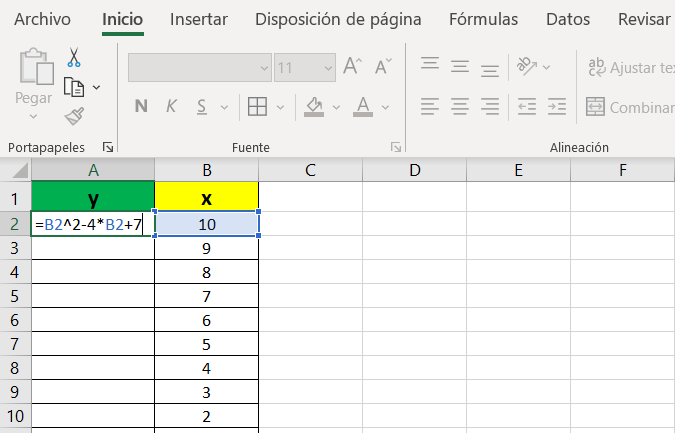
- Then, press Enter, select the square at the left side of the cell, and drag it to the last cell of x values. This way, we will obtain the other y values.
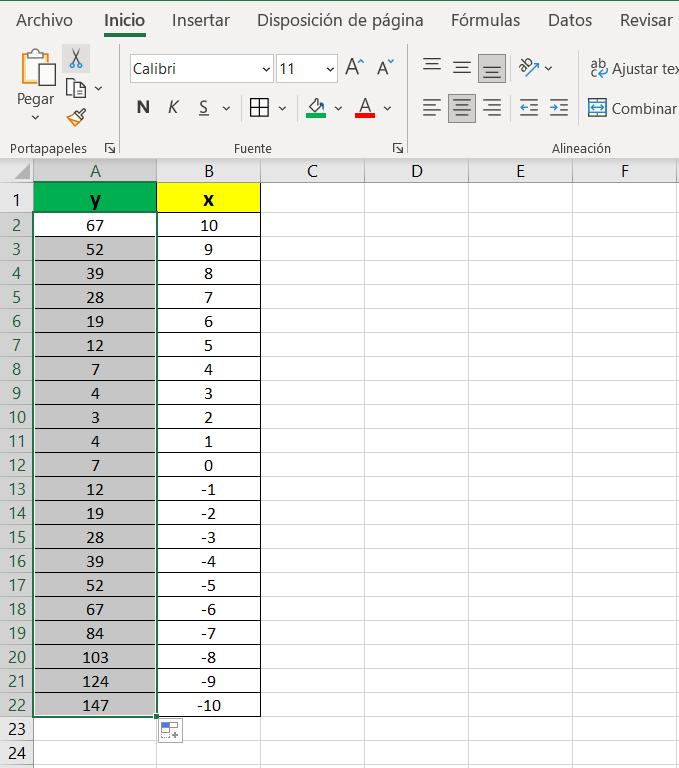
- Finally, select the data table, go to the Excel toolbar, find “Insert” then select “Scatter Plot” or “Scatter Chart” depending on your Excel version. Your quadratic function should now be graphed on the scatter plot.
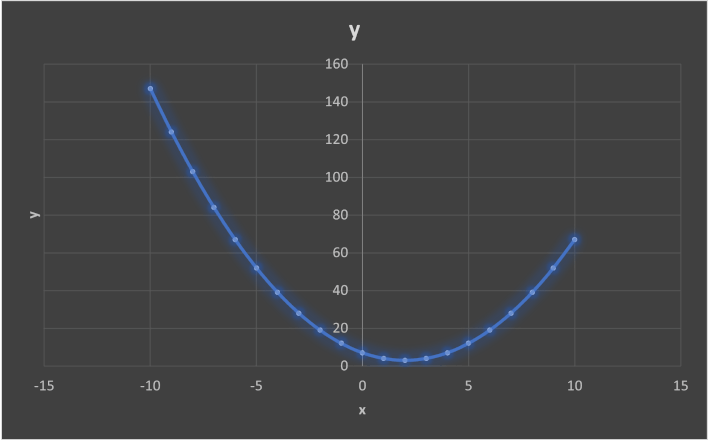
For further information and clarity, we recommend this YouTube video explaining step by step how to create the graph in Excel.
If you want to learn more about Calculus topics, visit our available content.
References
- Stewart, J.; Redlin,l.; Watson,S., 2012. Pre-Calculus. Sixth Edition. Thomson Learning. Mexico.
- For further illustration, visit: Wikipedia: Cartesian Coordinates.